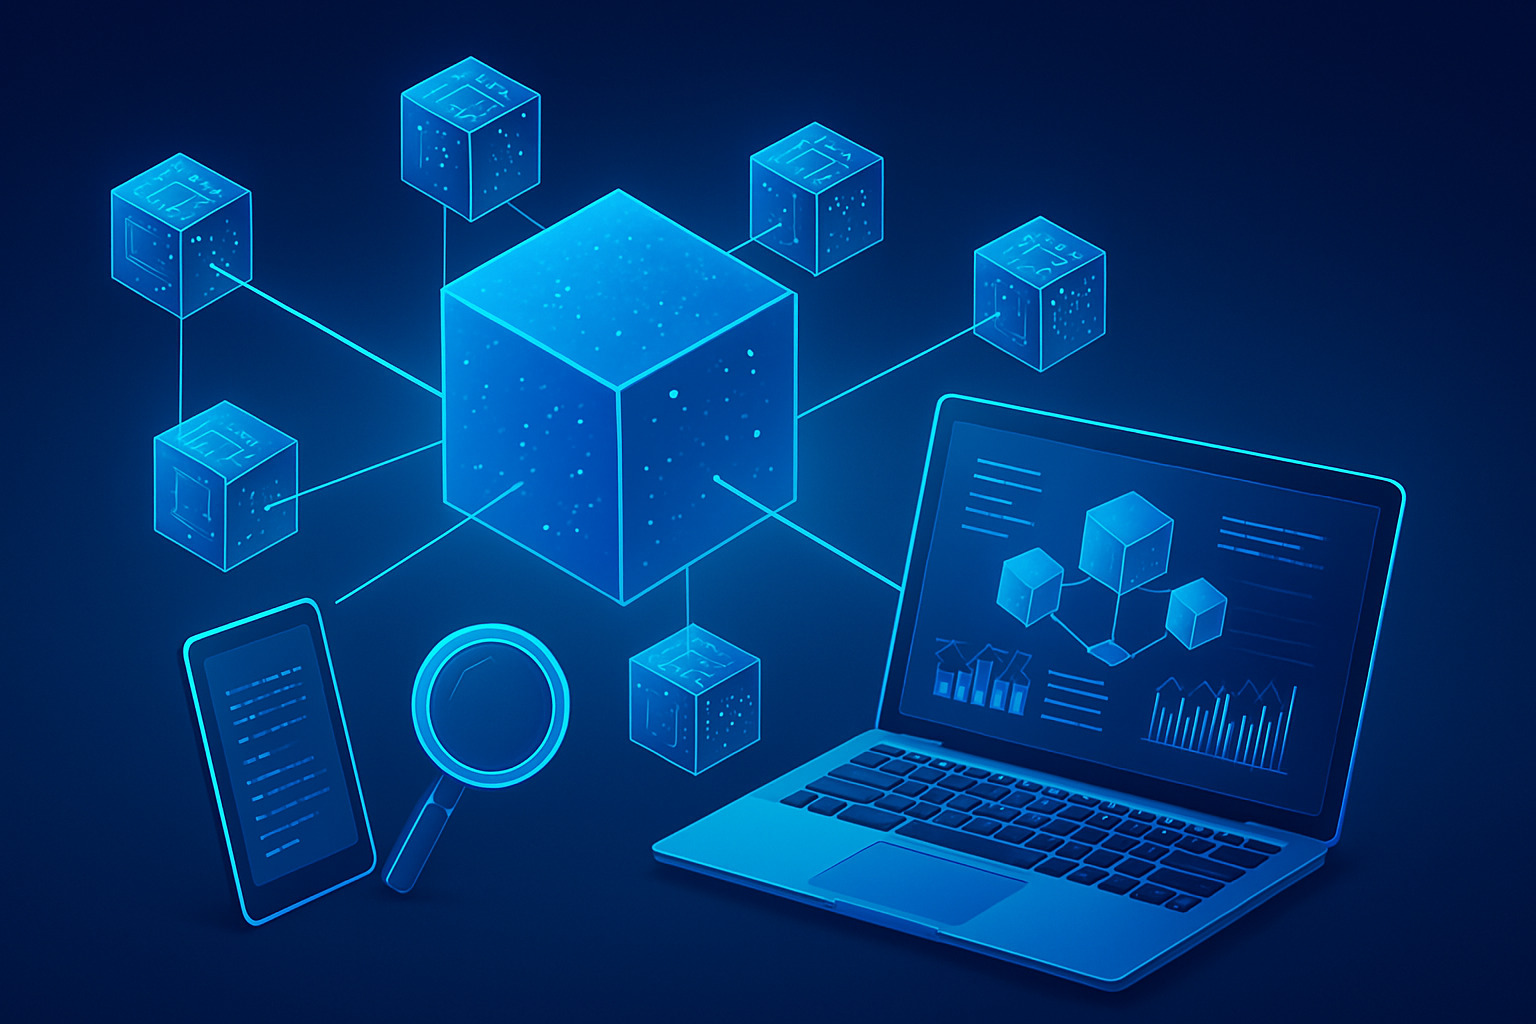
Smart contracts don’t have an off switch. Once deployed, they run autonomously, executing transactions exactly as coded. But what’s really happening under the hood? Blockchain data isn’t just a series of cryptographic hashes. It’s a ledger packed with raw, actionable information—if you know how to read it.
Understanding SmartChain data means more than checking your wallet balance or tracking a single transaction. It’s about seeing the bigger picture—identifying trends, spotting unusual activity, and making informed decisions. Whether you’re an investor, developer, or analyst, knowing how to extract and interpret blockchain data puts you ahead.
Breaking Down Blockchain Data
Blockchain data is stored in blocks, but there’s more to it than a simple chain of transactions. Each block contains details that, when analyzed, reveal insights about network activity, smart contract behavior, and user interactions.
The Basics of a Block
Before extracting insights, you need to know what’s inside a block:
- Block Header – Stores metadata, including timestamp, block height, and previous block hash.
- Transactions – The actual data being processed, which includes sender, receiver, value, and gas fees.
- Smart Contract Calls – Logs and events generated when interacting with contracts.
Types of Blockchain Data
Blockchain data falls into three main categories:
- On-chain Data – Everything recorded on the blockchain: transactions, wallet balances, contract interactions.
- Off-chain Data – Information stored externally but linked to the blockchain, such as exchange order books.
- Event Logs – Records of actions triggered by smart contracts, useful for tracking contract activity.
Understanding how to access and use this data is key to extracting meaningful insights.
Accessing SmartChain Data
Reading blockchain data isn’t as simple as scrolling through a database. It requires the right tools and techniques.
Blockchain Explorers
For quick lookups, block explorers are the easiest way to access on-chain data. Platforms like BscScan for SmartChain allow users to:
- Track transactions and wallet balances.
- View smart contract interactions.
- Check token transfers and gas fees.
But explorers only scratch the surface. If you need deeper insights, you’ll need more advanced methods.
Smart Contracts and APIs
For structured data extraction, APIs provided by services like Infura, Alchemy, and Ankr let you:
- Query blockchain state without running a full node.
- Fetch historical data efficiently.
- Automate monitoring for contract activity.
Running a Node
If you need full control over data, running your own SmartChain node gives you direct access to the blockchain. This is ideal for developers building dApps or analysts needing real-time insights.
Extracting Insights from SmartChain
Understanding blockchain data isn’t just about reading numbers. The real value comes from interpreting patterns and trends.
Identifying Transaction Trends
By analyzing transactions over time, you can detect:
- Network Congestion – Sudden spikes in gas fees signal increased network usage.
- Whale Movements – Large transfers can indicate market shifts.
- Contract Activity – A surge in interactions with a specific contract could mean an upcoming trend.
Tracking Smart Contract Activity
Smart contracts generate logs with valuable details. Key things to monitor:
- Function Calls – Identify how contracts are being used.
- Event Logs – Track when tokens are transferred or contracts are upgraded.
- Failed Transactions – High failure rates could signal coding issues or scam attempts.
Analyzing Gas Fees
Gas fees fluctuate based on network activity. Studying gas trends helps:
- Predict peak usage times.
- Optimize contract execution for lower costs.
- Detect potential MEV (Miner Extractable Value) attacks, where bots manipulate transactions for profit.
Detecting Anomalies and Fraud
Blockchain data is public, making it possible to identify suspicious patterns:
- Flash Loan Attacks – Large, rapid transactions exploiting contract vulnerabilities.
- Ponzi Schemes – Contracts with abnormal payout structures.
- Sybil Attacks – Multiple wallets controlled by one entity manipulating market conditions.
Tools for Blockchain Data Analysis
A raw data dump won’t tell you much unless you have the right tools.
Data Indexers
Platforms like The Graph make querying blockchain data easier by indexing smart contract events. These tools:
- Provide structured access to data.
- Reduce the need for complex blockchain queries.
- Help dApps efficiently fetch relevant information.
On-Chain Analytics Platforms
For deeper insights, services like Nansen, Dune Analytics, and Glassnode offer dashboards to track:
- Wallet behavior and large holders.
- NFT trends and token liquidity.
- Exchange flows and market sentiment.
Custom Scripting and Data Extraction
For full control over analysis, Python and Web3 libraries allow users to:
- Extract and clean raw transaction data.
- Build custom dashboards for tracking specific contracts.
- Automate alerts for unusual activity.
A free delimiter tool can help filter and separate blockchain data logs, making it easier for analysts to extract specific insights without manual formatting.
Reading Blockchain Data Like a Pro
Knowing how to access blockchain data is one thing. Understanding what it means is another.
Wallet and Token Movements
Big transfers often precede market moves. When tracking wallets:
- Watch for large token inflows and outflows.
- Identify accumulation or distribution patterns.
- Compare historical movements to price changes.
Smart Contract Adoption
A contract gaining traction usually signals an emerging trend. Signs to look for:
- Increasing unique wallet interactions.
- Higher transaction volume over time.
- New integrations with other dApps.
Liquidity and Exchange Behavior
Tracking liquidity flow helps predict token stability. Key indicators:
- High liquidity usually reduces price volatility.
- Low liquidity with sudden price jumps may indicate manipulation.
- Movement between wallets and exchanges often signals trading intentions.
Final Thoughts
Blockchain data is more than just a record of transactions. It’s a real-time insight engine—if you know how to use it. Whether you’re tracking smart contract adoption, studying gas fee trends, or identifying market movements, understanding how to read and extract insights from SmartChain gives you an edge.
The tools are there. The data is open. Those who know how to interpret it make the smartest moves.


